
The problem you told us about
Until now, the Portfolio screen showed a handful of numbers, but they did not always explain how they related to each other. You could see how much you had lent and roughly what was expected that month, but you could not easily understand where a particular month's money had gone. For anything beyond the headline numbers, you had to write to support.
What’s changed
One number at the top
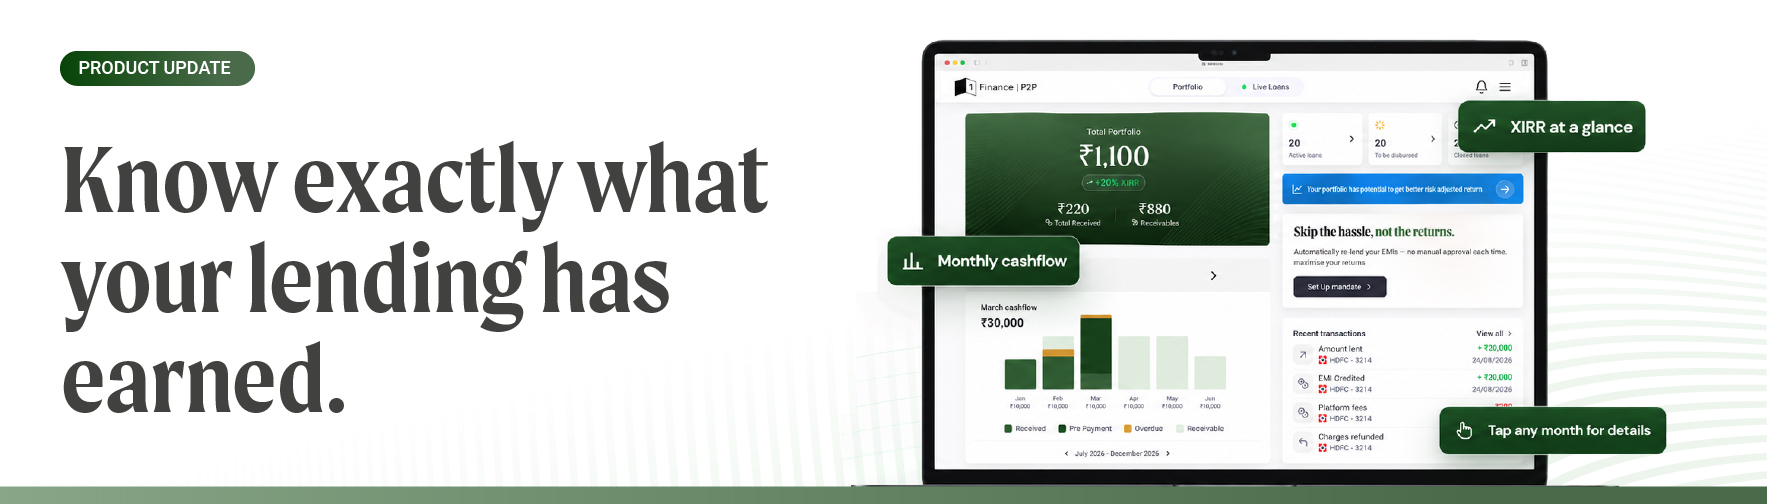
The Portfolio home now leads with your total portfolio value. It is calculated using the principal you have lent, interest already received, interest still expected on performing loans and a deduction for principal outstanding on loans classified as non-performing.
Money committed to a loan but not yet disbursed is not included. Since it has not been lent yet, it earns nothing and is not part of your portfolio value.
Expected interest is clearly shown
Part of your portfolio value may include interest you have not received yet. This is now clearly stated on the screen so you know how to read the number.
When you drill down, interest received and interest expected appear as separate rows. Interest received is money that has already reached your account. Interest expected is based on the repayment schedule, assuming the borrower continues to pay as scheduled.
Your return
XIRR is now displayed for your active and closed loans together. Non-performing loans are excluded from this calculation.
Cashflow, month by month
The Portfolio now includes a cashflow chart showing six months at a time on a wide screen and four months on a phone. Each bar shows its month and amount as text underneath because the vertical scale adjusts to the range being viewed.
Past months are shown with solid bars, while future months use lighter bars. Past bars show what actually arrived, while future bars show what is expected from the loans you currently hold.
Inside a month
Tap any month to open its complete details. The header shows the month, year and total cashflow. A single bar then shows how the total is split, with each component named and priced below it.
Each component has its own collapsible section. Open one to see individual repayments, including the borrower's name, amount and date the money reached you.
For example, if four borrowers paid on the third of the month, you will see four separate repayment rows against that date.
Prepayments
When a borrower pays ahead of schedule, the amount is shown separately as a prepayment instead of being included in the ordinary EMI total.
It appears as its own part of the month's bar and has its own section below.
When a repayment is late
A repayment that is not yet due, or is up to 10 days past its due date, still counts as receivable.
From 11 to 90 days, it counts as overdue.
Past 90 days, the loan is classified as non-performing.
Two ways of counting a month
The cashflow chart and month view organise repayments according to the month they were scheduled. Your received history organises them according to the month the cash actually reached you.
So, if a repayment was due in March but reached you in April, it will appear under March in the cashflow chart and under April in received history.
Both are correct. The chart tells you what was scheduled, while received history tells you what actually arrived.
Loans, mandate and recent activity
A counter now shows how many loans are currently active and opens the loan list when you tap it.
If you have loans that have been committed but not yet disbursed, or loans that have already closed, more detailed loan level information, including charges, total charges and specific loan wise details, is available when you open the Active Loans card.
If you do not have an active mandate, a card will offer you the option to set one up.
A mandate is your standing authorization for the platform to debit your account when you commit to funding a loan. This makes it possible to re-lend repayments without approving each transfer individually.
At the bottom, you can see your four most recent transactions. Each transaction shows what it was, the bank account it moved through, the amount and direction, and the date.
Money coming in and going out are distinguished using icons, signs and colour. View All opens the complete transaction history, where you can filter transactions by credits and debits.
If you have not lent yet
The screen continues to work even if you have not started lending.
Your portfolio value shows zero, the counters show zero and FAQs remain available where they were before.
If you have committed to a loan that is awaiting disbursal, the counter makes it clear that no principal has gone out yet.
Why is this important
You can now understand your lending portfolio without having to piece together different numbers or contact support for basic details.
The Portfolio screen separates money you have already received from money you are expected to receive, distinguishes scheduled cashflow from actual cash received and lets you drill down from your total portfolio value to individual borrower repayments.
In short, the number at the top gives you the whole picture, while everything underneath helps you understand exactly what makes up that number.
Where to find it
Open Portfolio in the 1 Finance P2P app.
The portfolio value appears at the top, with the cashflow, returns, loans, mandate and transaction details available below it.